
Safe Blues: A Method for Estimation and Control in the Fight Against COVID-19
Since the start of the COVID-19 epidemic, I’ve been working on a novel technique for fighting the epidemic with a varied team of excellent researchers from the University of Queensland, the University of Melbourne, Cornell, and MIT.
Basically the underlying problem in any model one constructs to predict the spread of an epidemic as a function of social interaction, is the question of how to measure that social interaction. You might come up with some simple ideas like, “let’s just count how many people you interact with daily”, but that would weigh seeing a member of your family who lives in the same house equally to a person you meet at the airport. So maybe you’d then come up with a way to factor in time, or something. This is really hard! And so the main idea behind Safe Blues is that instead of trying to guess what a good summary of each person’s exposure levels would be, you can just simulate the pandemic, and that should be a much better indicator of how likely someone is to get the disease!
You can then use this “measure” of the rate of social interaction to train sophisticated machine learning models and make much better, real-time predictions of how current interaction levels are affecting the spread of the disease. This is crucial because people are often asymptomatic for a few days, and then their tests take a few more days, so it’s common for an infected person to be a part of the community for around two weeks before they’re identified as a case, whereas Safe Blues allows real-time information on this!
Here’s a pretty diagram:
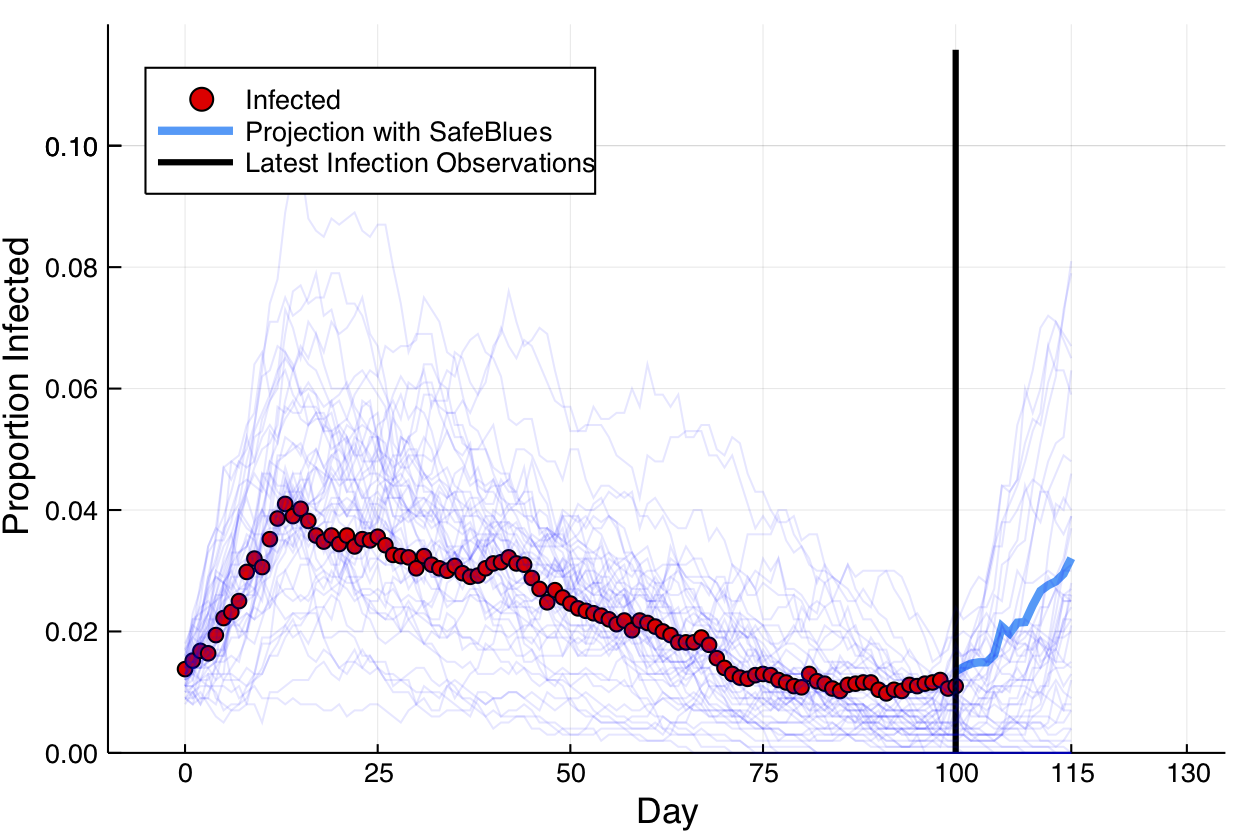
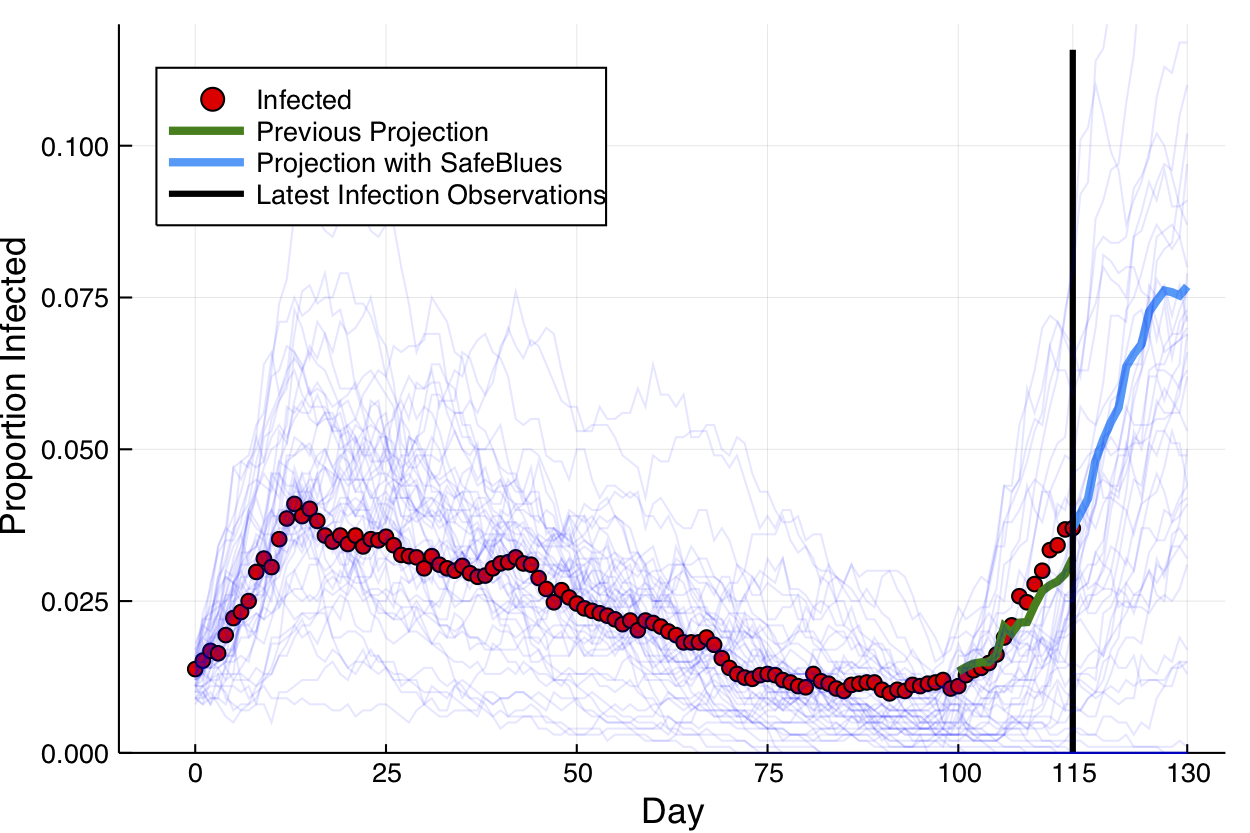
The blue lines represent Safe Blues strands, the red markers are the true numbers of infectives, and the blue line represent a Safe Blues prediction of the state of the epidemic. The simulation assumes that real case numbers are delayed by 15 days, which reflects the reality of COVID-19: a long incubation period and mild symptoms at the start of infection mean that diagnoses are significantly delayed, while Safe Blues data is received in real time. In this way, the Safe Blues framework may provide unique, invaluable visibility into the current state of the epidemic and a powerful tool for early detection of subsequent waves or outbreaks.
Read the medRxiv paper or see the website for more info! I’ve also been working on a minimal implementation based on OpenTrace here.